First Input Delay, how to improve the metric on site pages
We will never have “a second chance to make a first impression”, and for this “perfecting the first input delay is the key to a great page experience”: it opens with these words, simple and clear, the video with which Google’s Patrick Kettner accompanies us towards in-depth study on how to measure and improve the FID, a metric that, as we know, is part of the Google Page Experience package and, therefore, is a ranking factor on the search engine.
Website delays create frustration and bad experience
Technically, the First Input Delay is an API that measures how long our site takes to react after a user has interacted with it.
In his speech on Youtube, Kettner explains that it is important to make sure that people who use our site suffer and feel as little delay as possible, since delays “interrupt us, disrupt our thought process and make it harder to concentrate or complete our goals”, creating a frustrating experience when we are trying to browse a site, use an app or just watch a video.
The FID metric, to evaluate interactivity times
Just to reinforce this concept, the metric of the first input delay (FID), a web API that is also part of the inaugural group of Core Web Vitals identified by Google last year, has been inserted within the complex of page experience factors.
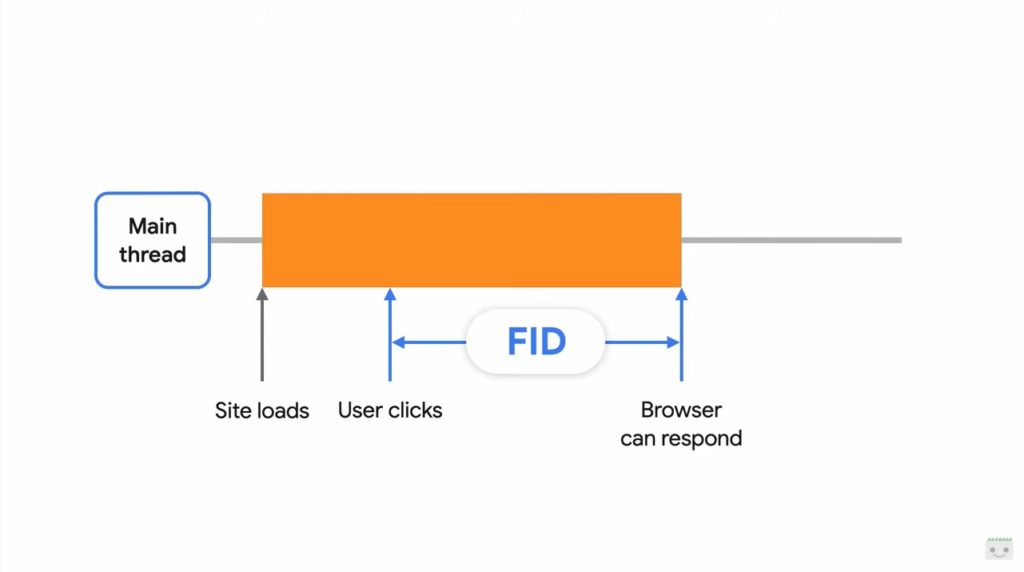
In particular, the FID “measures how much time in milliseconds your site needs to react after someone interacts with it”, which is the time that goes from when a user clicks on a button or touches a text input until the browser actually starts to respond. With this metric, therefore, “we measure the delay in the processing of data and interactions, not the time actually needed to process that data“.
According to Google’s Developer Advocate, we can think of the first input delay as given on “how long it takes for your page to appear to be interactive and responsive to the user the first time he uses it”.
Measuring the First Input Delay
Just like every part of the Page Experience, every single url of the site is evaluated based on the FID independently, relying directly on data from real users that your site. Whatever the page score, then, we can be sure that the numbers we read reflect what users are actually experiencing, because the FID scores come from the monthly report on the Chrome user experience, as we already said in this article on Core Web Vitals measurements.
Another aspect on which Kettner invites us to reflect is that “the homepage might have fantastic values, but the product page or articles might be a bit far from perfection”, but the performance result of a page – regardless of which one it is, positive or negative – does not impact on that of another page because in the page experience “each URL is an island”.
How to find and read First Input Delay values
Being a metric intrinsically built on the time when a site reacts to interactions, to get an accurate measurement of the First Input Delay we can rely only on user measurements that come from real world users, Internal and private analytics and data that we can view within the Search Console Core Web Vitals report.
You can also quickly check the performance of our pages with the Pagespeed insights tool – an online hosted version of the same tool as Lighthouse, which is part of the Chrome dev tools – showing the performance of pages in a test environment configured to approach the connection speed and device performance of an average Web user today.
If a url has been online for more than a month, finally, it can be included in the Chrome user experience report, which directly indicates the actual results for the three Core Web Vitals parameters.
What are the scores of FID
So now we have the value of the First Input Delay of the pages of our site, but how should we interpret this number? Kettner again explains it, remembering how for the Vitals Web Cores within the Page Experience “there is no such thing as passing or not passing”, because these parameters are all used as guides that the Google Search uses to create “relative performance differences between Urls, so as to verify how they behave in relation to each other”.
In general, however, there are values to refer to: “A good goal is to have about 75% of visitors to your site visitors who experience a delay in the first input of less than 100 milliseconds”; this time interval of 100 milliseconds has long been considered the point where people perceive user interfaces as if they were acting instantly.
Situations begin to become problematic when the delay extends between 100 and 300 milliseconds, while “anything over 300 milliseconds is a considerable delay and will likely cause a worse experience for your users”.
In addition, it should be made clear that in order to have a FID value you need the page to provide user interaction: otherwise, if your page does not offer anything to interact with or if people never click on buttons or inputs, there will not be a registered FID value.
How to manually measure the First Input Delay manualmente
If we want to calculate the first input delay of new pages or Urls not included within the Chrome User Experience Report just serves “a little extra effort”, because you can “understand the FID by yourself using the same APIs, as all the field data of the Page Experience comes from your real real world users”.
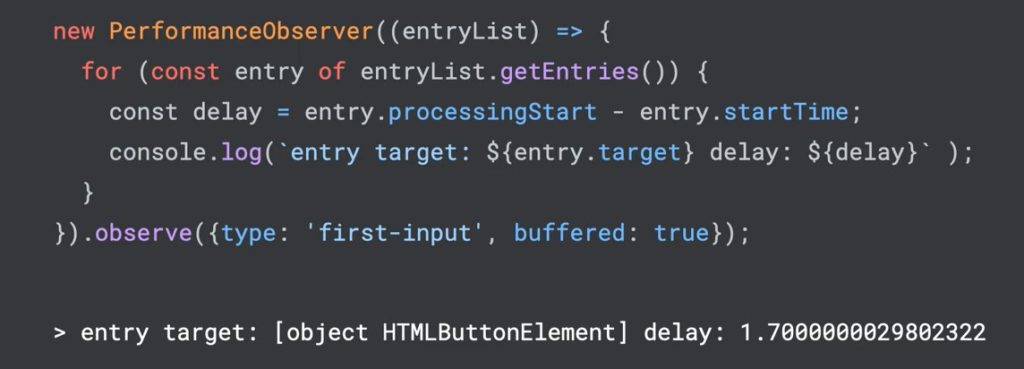
Generally speaking, all of us can manually calculate the FID by “adding some Javascript to our page”: all essential Web signals are in fact available via Javascript API and, specifically, through PerformanceObserver. These observers give us an event or a list of events that match the type of performance events that interest us.
When the browser determines that a first input has taken place, it will perform the function we have set, passing us the list of events that correspond to what we have requested; although the first input will probably have only one event, The PerformanceObserver will always give us a list of events to our callback, so our code will iterate on the responses calling getEntries.
For each item, we look at the beginning of the processing and subtract the start time: the difference allows us to quantify the delay of the first input. We can take these numbers and send them to our analytics infrastructure to start getting a good idea of what our FID results will be like.
Using analysis tools allows us to perform a much more detailed data monitoring, for example bringing out patterns such as the user’s location, the type of device used or other information that may not be so obvious through the official Page Experience tools.
Common issues with FID and practical solutions
The Google video also accompanies us to the discovery of some common problems with the First Input Delay, providing practical guidance for the positive resolution of such situations, which often results in an intervention to speed up Javascript.
- Defer, delay or delete JavaScript
By definition, Kettner tells us in fact, “any delay that is occurring is related to the Javascript code that is running on your page”, because all the page code runs in the same thread by default and the browser can only do one thing at a time. So, just a little bit of code that takes longer than expected is what it takes to block everything, even actions that people who use the site might try to do.
This could depend on “a big chunck of Javascript that is analyzed or uploaded when the page is initially uploaded to an event handler, by an event handler blocked by something heavy or just slow, or by an excess of code that is trying to run at once”and causes an overall slowdown of the site.
Therefore, if we have problems with the First Input Delay, the first suggestion is to check if we are loading too much Javascript – the quantitative reference is “anything larger than 200 kilobytes” – and then proceed by verifying the code splitting, the subdivision of the code, that it is a feature embedded in all the modern Javascript bundler, that they allow exactly to subdivide the code in smaller pieces in order to avoid to block the rest of the page from the react to the input of the user.
After splitting, any code that is not essential for page loading should be loaded using async or defer attributes on their script tag: by using defer we tell the browser that the script will not change the page layout, so it should not block the rendering of the page while it is loaded or scanned. The async attribute is very similar to defer, only it takes it one step further, because it signals not to wait for any other script: using async we tell the browser to run the code without blocking any other script in advance.
Since we are already digging into the source code, the Developer Advocate advises us to search for “code that can simply be deleted“, because it can be easy to accidentally include polyfill or workaround long after they are actually needed.
- looking for heavy UI
Often, the first interaction a user has with a page is something located at the top of the page, things like a menu button or search input; if we experience problems with the FID but we can’t understand what is causing that score, it’s a “Good idea to start tracing the elements of your page which delays are measured”.
We can use the snippet of code we were working on before, from which we can have access to the API of the same entryobject, and in particular entry.target, which allows us to actually know what is the measured delay of the element with which we were interacting.
This step can be really useful if we have on the page a large number of links, buttons or other clickable or tappable elements and we are not entirely sure which one is dragging the performance scores down.
After finding out which target is often associated with people who have a high FID, we can “start digging into the code of the site” to understand what events are linked to it and any listeners eventually connected.
- Interrupting long tasks
The third aspect to consider is the division of long tasks (already at the center of these tips to optimize the Page Experience of the site): although our code does not need to be divided, it may still be useful to intervene on tasks, which are “only things your code is doing, such as writing your web app, downloading states or reactions to user input”.
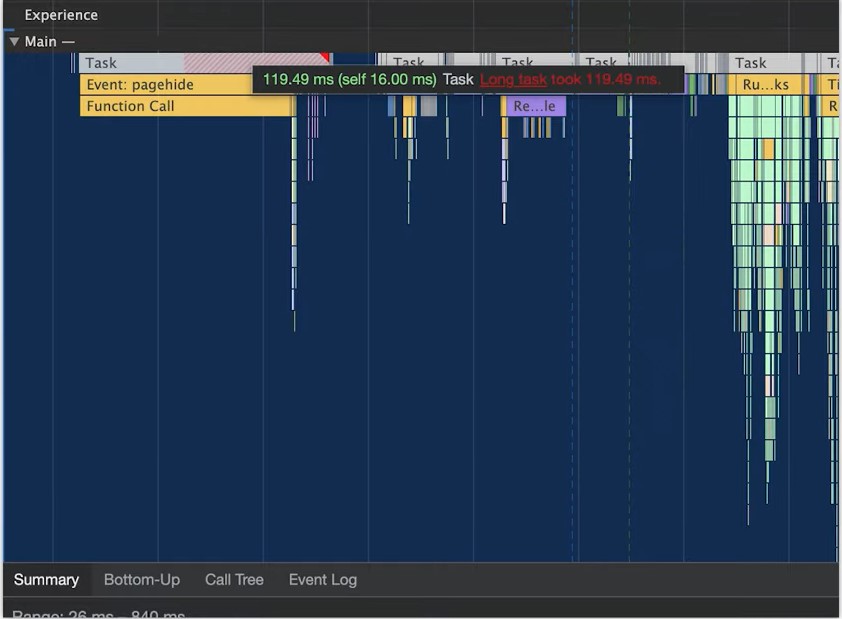
A task is long when “it takes more than 50 milliseconds to complete”, says Kettner, and if we have problems with the First Input Delay “looking at long tasks is a great place to start to see where they could potentially make improvements“. Also, remember, long tasks are highlighted in Chrome Dev tools.
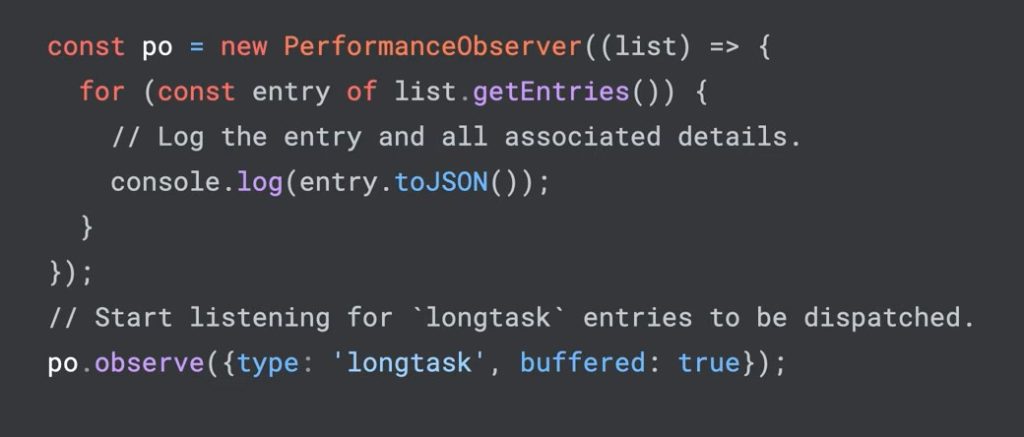
If we want to look for long tasks “on users’ devices to build a correlation between the results of the experience on the page and long activities on the field, we can programmatically access it in the way seen before for the first input event”.
In practical terms, we first need to create a PerformanceObserver and then look at the type of long task; afterwards, we can repeat the operation on each instance to examine each attribution, so as to get “some information about functions that can be last a bit“.
As the Googler points out, “devtools is definitely a better tool, but this API allows you to collect that information from your users and your analytics tools, so you can track correlations that may be difficult to find in your local devtools setup”.
When we find a long-term task, the next step is to try to subdivide it into smaller asynchronous functions: “this can be as simple as wrapping the code in set timeouts or requiring animation frames, but the specifications always depend on the specific situation”.
First Input Delay, the opportunity to optimize the Javascript code on the site
Usually, the improvement of the first input delay “comes down to optimize the when, where and why of the Javascript code on your site“: the goal should be “to limit the use of JS to the minimum necessary to maximize the potential of the site”.
The experience of the page is new, but the ideas behind it are “solid and user-focused: if we can achieve great results, then visitors to the site will all be happier“.


