Content KPIs: what they are and how to monitor them in each stage of the funnel
For years now content marketing has been one of the main themes of marketing, especially in the digital field; to achieve the objectives, however, it is not enough to launch a campaign and cross your fingers, because part of the work is also related to the measurement of the ROI and the effects that work brings in concrete terms. Only in this way, in fact, is it possible to improve the strategy, analyzing the mistakes made and finding the solution to optimize efforts.
What we must remember, first of all, is that each content should be created to meet the intentions of a user, which are often explained in the form of a marketing funnel: if we are able to identify which point of channeling we are working with, we will be able to choose the metrics to actually define the success of that content.
Content KPIs and the marketing funnel
To help us in identifying the main content KPIs to be analyzed for the main marketing funnel stages is an article by Brie E. Anderson on Search Engine Journal, which focuses in a particular way on the key performance indicators to be evaluated in relation to awareness, content engagement, conversion and loyalty.
The awareness stage
The content in the awareness phase is focused “on grabbing the attention of those who have a problem you can solve,” the author says.
With this in mind, these are the main Kpis to be evaluated and measured:
- Impressions of organic search
SEO can meet the funnel awareness part by providing data on impressions on the search engine results pages (SERP).
When the right page of our site appears in the search results, users realize that our company offers a solution to their problem: the more often we present ourselves, the greater the chances of attracting their interest.
We can measure organic search impressions for our content using Google Search Console and Bing Webmaster Tools, as well as of course SEO suites like SEOZoom for broader analyses.
- Share of Voice
The share of voice (Sov) is a percentage metric that measures “the advertising weight” of a brand, its visibility value compared to competitors, calculating the frequency with which the brand name is displayed in the SERP compared to the total number of searches for the selected keywords.
For example, Anderson explains, if we appear 200 times out of 1000 keywords you search, our Sov would be 20%.
This metric gives us good guidance on whether or not our content is displayed for content searches that we have created, and we can monitor Sov in some search platforms.
- New users
New users are those who have never been on the site before; therefore, they are an excellent indicator of how many people have found us through a specific content.
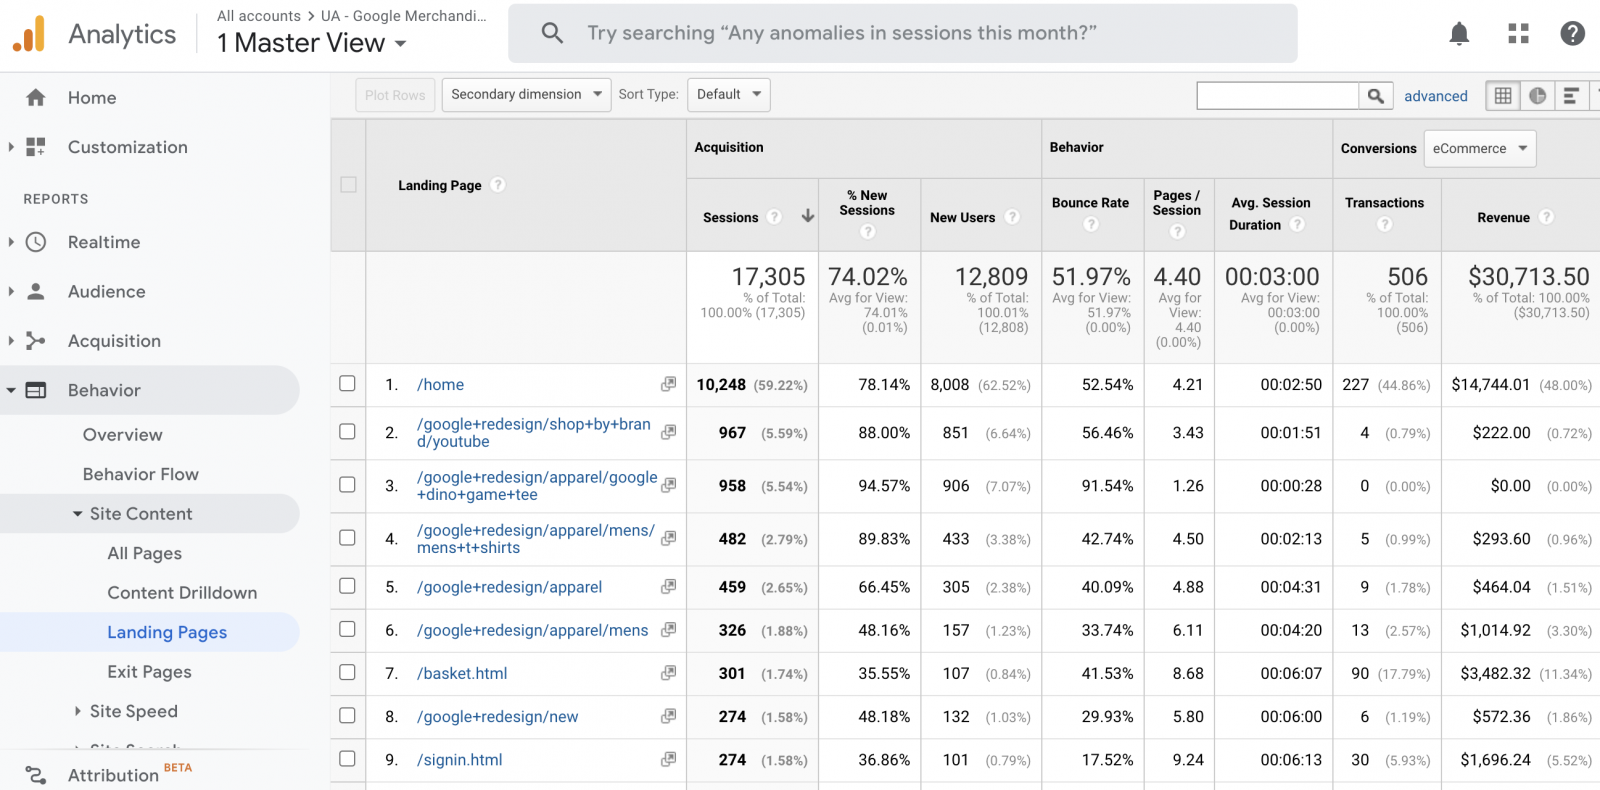
We can monitor new users with Google Analytics, remembering to review this metric after setting the display “Landing Page”.
The engagement stage
The funnel engagement phase is extremely important, as it shows that people really care about our business and what we do and propose; it is also a step forward in convincing users to do business with us.
At this level, we must evaluate the following KPIs:
- Clicks
The clicks indicate that at least the title of the content was engaging, otherwise people would not have chosen to click on the result that appeared to them.
We can measure clicks from the SERP, clicks from social media posts to our site, or any other click that brings people to the content we have posted.
Clicks can also be monitored as “sessions” on the site using Google Analytics, trying to analyze the traffic that has arrived through a specific content; in addition, they can also be viewed on specific social platforms, on Google Search Console, Bing Webmaster Tools etc.
- Bounce rate
Once users are on the site, the first sign of their engagement is whether they stay on our pages and do not bounce back.
A bounce essentially happens when someone who arrives on the site and then leaves immediately before interacting.
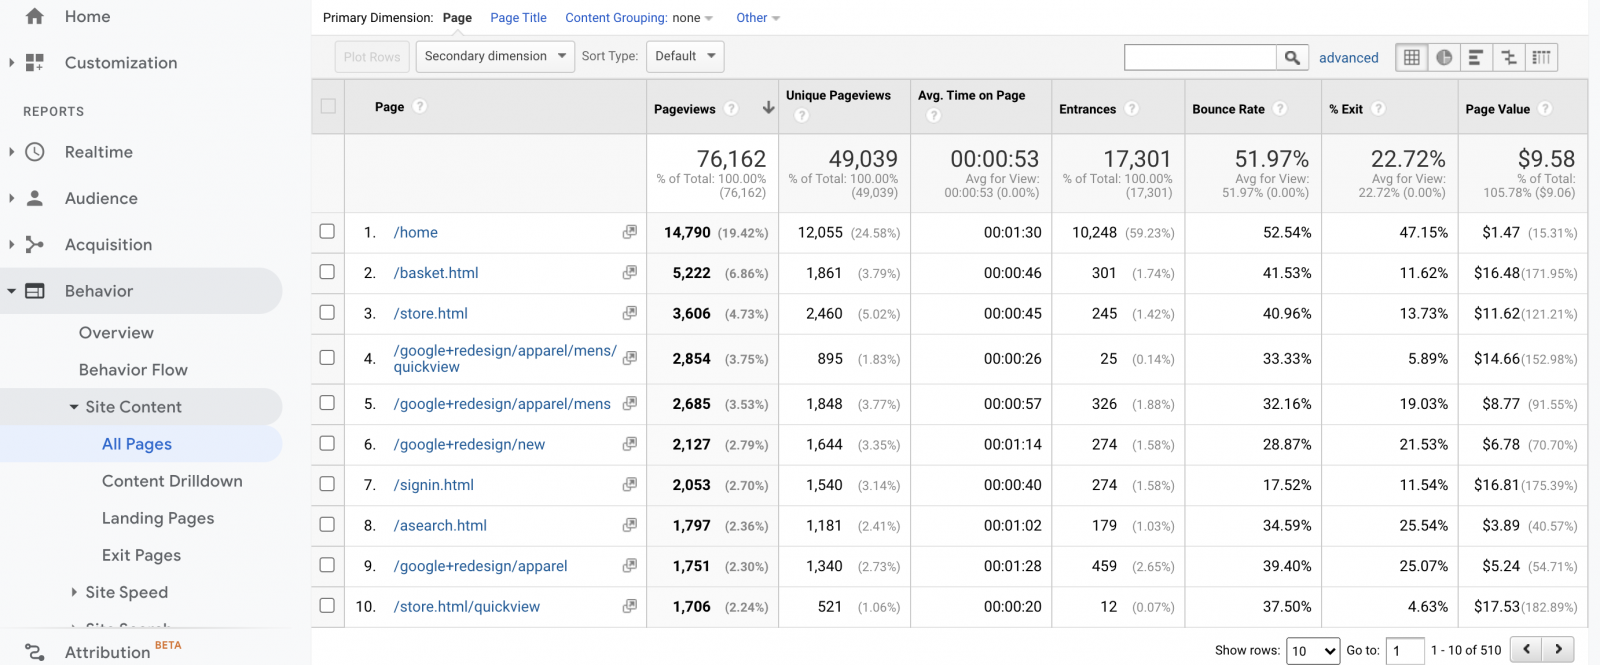
We can monitor the bounce rate using Google Analytics, by which we measure the bounce rate for the page in general and the bounce rate on the page from specific sources, to get a better idea of the involvement of different audience segments.
- Average time on the page
If a person spends time with our brand, they are interacting with it.
If we create a 5,000-word “Final Guide” content “and the average time on the page is less than 20 seconds, it is likely that people are not affected by that specific content”.
Again, Google Analytics can help us track this information.
- Scroll depth
The scroll is a sure sign of involvement as it does not happen alone: the user must perform it.
While other metrics may be distorted by accidental actions (click or forget to have opened a window on the browser), it is not easy to simulate scrolls. Typically, if a user scrolls, they are looking for something (hopefully something we offer).
We can measure scrolls using Google Tag Manager and Google Analytics.
The conversion stage
It is one of the main moments of funnel for our activities, because it concerns the concrete possibility of making money.
Conversion tracking helps us leverage when we try to push for new content creation and also helps demonstrate the value of the content we have already created, and we can analyze these KPIs:
- Goal completions
Goal completions “can be a myriad of different things, such as form fillings, a video view, a download etc”.
Depending on the goal of our content, these goals can be considered conversions; regardless of what we hope users will do after interacting with our content, that event can be monitored as a goal, that we can track using Google Tag Manager and Google Analytics.
- Purchases
Purchases are much easier to understand: if a user makes a purchase, he has converted and is now a customer.
In Google Analytics we can track purchases in which users have also visited the content by adding a new segment based on a “Visited page title” condition.
- Revenue
Another important metric is the return on investment (ROI) on the content created: to calculate it, we need to know what/how much we have invested in creating the content and how much revenue that content has generated or helped to generate.
We can track revenue from sessions where the page was also visited using the same conditional segmentation used in the Google Analytics Purchases section.
If our transaction cycle is a bit longer, it might be a bit harder to monitor.
The loyalty stage
In marketing, “it is 100% true that it is cheaper to keep a user than to earn a new one,” Anderson says; so the best thing we can do as a company is to make people come back.
Tracking loyalty can easily show us how much money we have saved by keeping people in our funnel, and these are some of the KPIs to evaluate:
- Returning users
If our contents bring people back to the site, it means they are helping build loyalty.
The more a person visits our website to interact with the content, the more likely it is that we are at the Top of Mind stage (to use the terminology of the Aaker pyramid) and that we are matching a need.
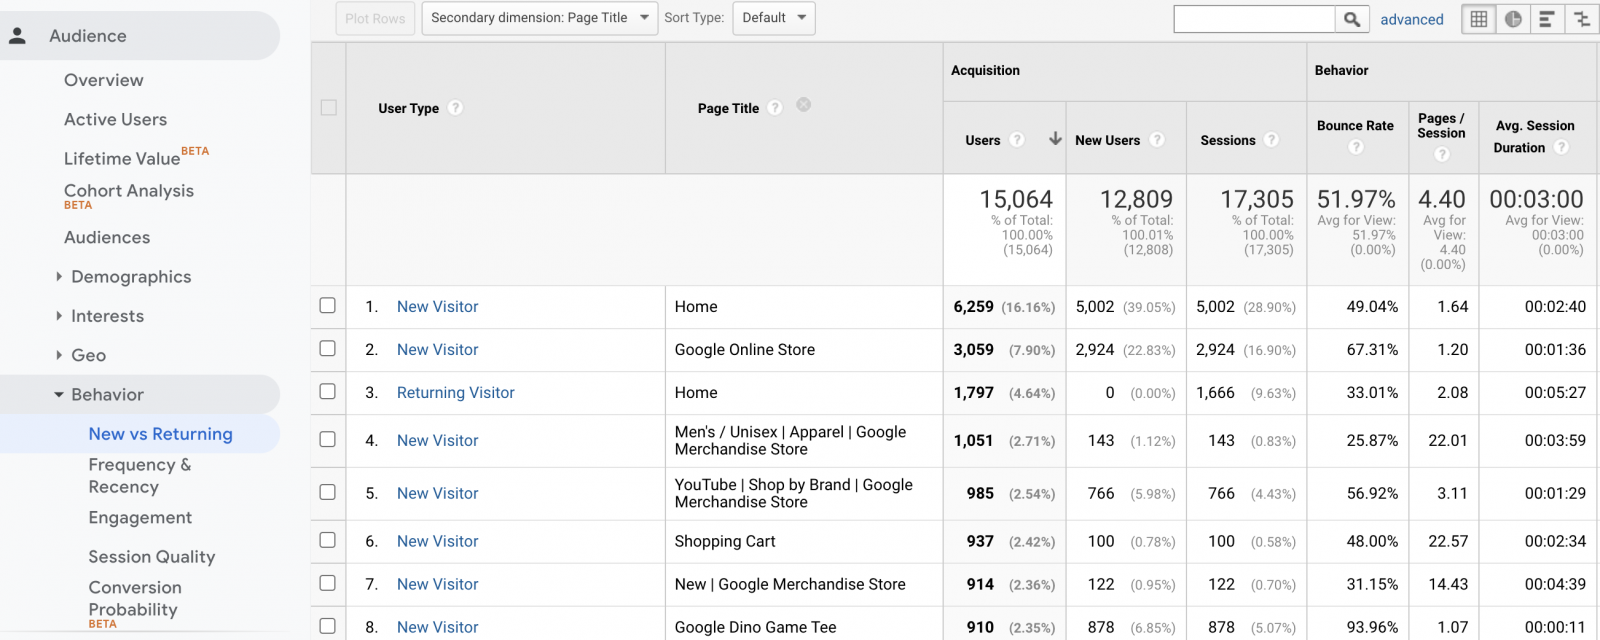
Users returning to a specific page are easy to monitor in Google Analytics using the secondary dimension “Page Title”.
- Repeat business
Repeat business “it’s even better than repeat visits, it’s the ultimate loyalty vow“.
If the customer has already done business with us and actively chooses to do so again, it has found value in our brand and our business.
To keep track of repeated activities “you are likely to have to rely on our point-of-sale system or a customer relationship management system”.
The importance of monitoring and data for the business
The final piece of advice of Brie E. Anderson – which contains the message of his article – is that it is essential to set up monitoring tools for content marketing, but above all that “data are only useful if we use them“.
In concrete terms, what is needed is to choose a goal, decide which content KPIs to monitor and then make decisions based on the data collected: the only way to really move strategically and improve the work.


